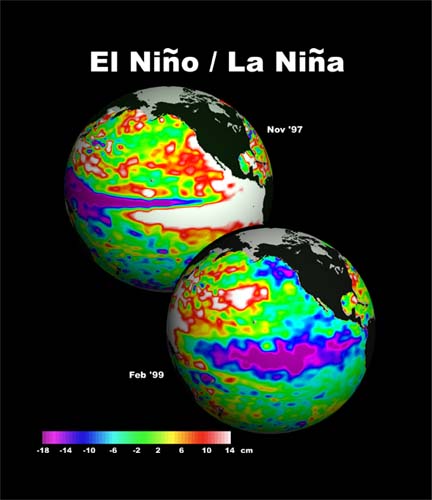
El Niño and the Southern Oscillation, also known as ENSO is a periodic fluctuation in sea surface temperature (El Niño) and the air pressure of the overlying atmosphere (Southern Oscillation) across the equatorial Pacific Ocean. Source: NOAA - http://www.ncdc.noaa.gov/teleconnections/enso/
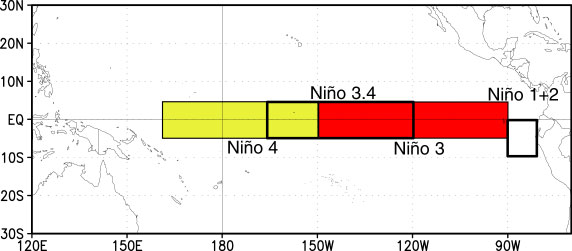
The Oceanic Nino Index (ONI) is one of the primary indices used to monitor the El Nino-Southern Oscillation (ENSO). The ONI is calculated by averaging sea surface temperature anomalies in an area of the east-central equatorial Pacific Ocean, which is called the Nino-3.4 region (5S to 5N; 170W to 120W). Also, a 3-month time average (running mean) is calculated in order to better isolate variability closely related to the ENSO phenomenon. Source: NOAA - https://catalog.data.gov/dataset/climate-prediction-center-cpcoceanic-nino-index
The Oceanic Nino Index (ONI) is one of the primary indices used to monitor the El Nino-Southern Oscillation (ENSO). The ONI is calculated by averaging sea surface temperature anomalies in an area of the east-central equatorial Pacific Ocean, which is called the Nino-3.4 region (5S to 5N; 170W to 120W). Also, a 3-month time average (running mean) is calculated in order to better isolate variability closely related to the ENSO phenomenon. Source: NOAA - https://catalog.data.gov/dataset/climate-prediction-center-cpcoceanic-nino-index
|
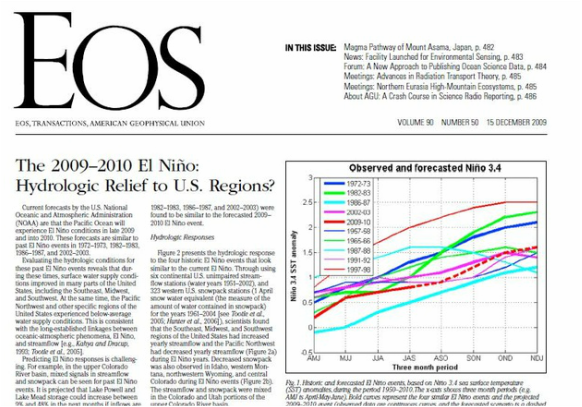
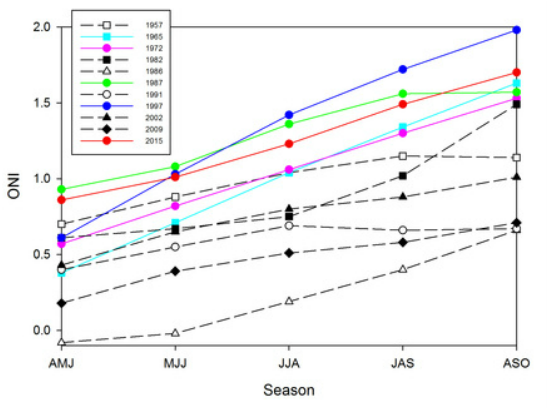
We followed similar procedures as published in EOS, Volume 90, Number 50, 15 December 2009 entitled The 2009-2010 El Nino: Hydrologic Relief to U.S. Regions?. Ten El Nino's were identified: 1957, 1965, 1972, 1982, 1986, 1987, 1991, 1997, 2002 and 2009. The seasonal ONI (AMJ, MJJ, JJA, JAS, ASO) for each of these El Nino's was correlated with seasonal ONI for the 2015 El Nino and those El Nino's which correlated at a significance greater than 99% were retained. Next, the two sample t-test of the means (99% significance) was performed with the retained El Nino's seasonal ONI and the 2015 El Nino ONI. This resulted in four El Nino events (1965, 1972, 1987 and 1997) being similar to the 2015 El Nino event.
|
| ||
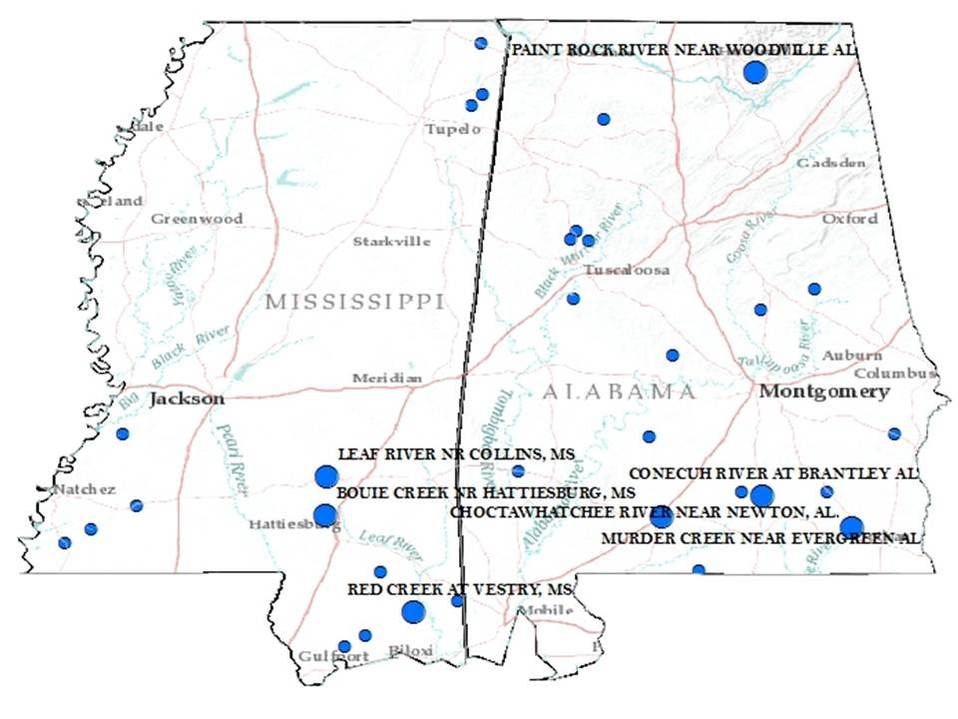
The U.S. Geological Survey's (USGS) Hydro-Climatic Data Network - 2009 (HCDN-2009) is an updated listing of streamgaging stations where discharge primarily reflects prevailing meteorological conditions (unimpaired stations). The stations have been screened to exclude those where human activities, such as artificial diversions, storage, and other activities in or near the stream channel, affect the natural flow of the watercourse. The purpose of the network is to provide a streamflow data set suitable for analyzing hydrologic variations and trends in a climatic context. Source: USGS - http://water.usgs.gov/osw/hcdn-2009/
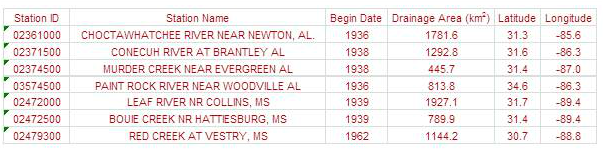
Thirty-two (32) unimpaired stations were identified in Mississippi (MS) and Alabama (AL). The USGS National Water Information System (NWIS) - http://waterdata.usgs.gov/nwis was accessed to determine the availability of historic monthly streamflow (cfs) for the 32 stations. Seven stations were identified which had a minimum of 50 years of continuous data.
Thirty-two (32) unimpaired stations were identified in Mississippi (MS) and Alabama (AL). The USGS National Water Information System (NWIS) - http://waterdata.usgs.gov/nwis was accessed to determine the availability of historic monthly streamflow (cfs) for the 32 stations. Seven stations were identified which had a minimum of 50 years of continuous data.
|
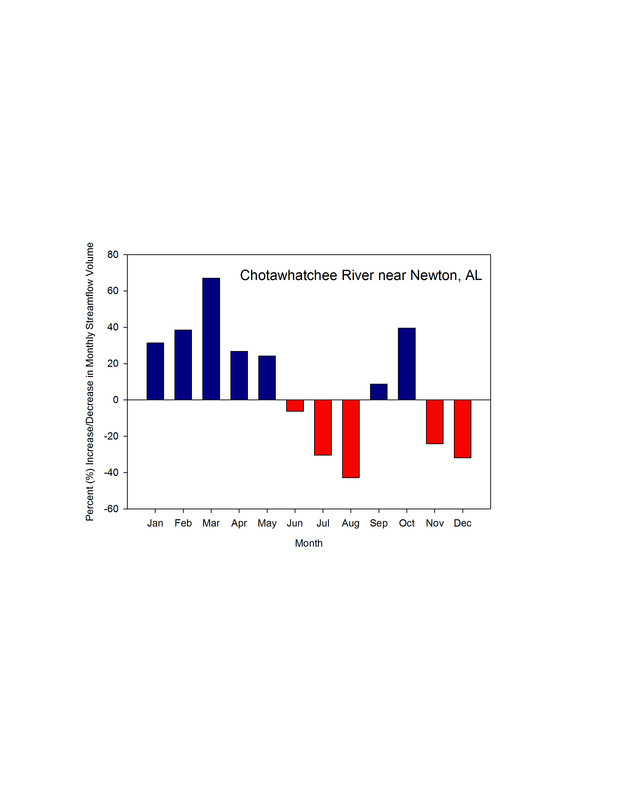
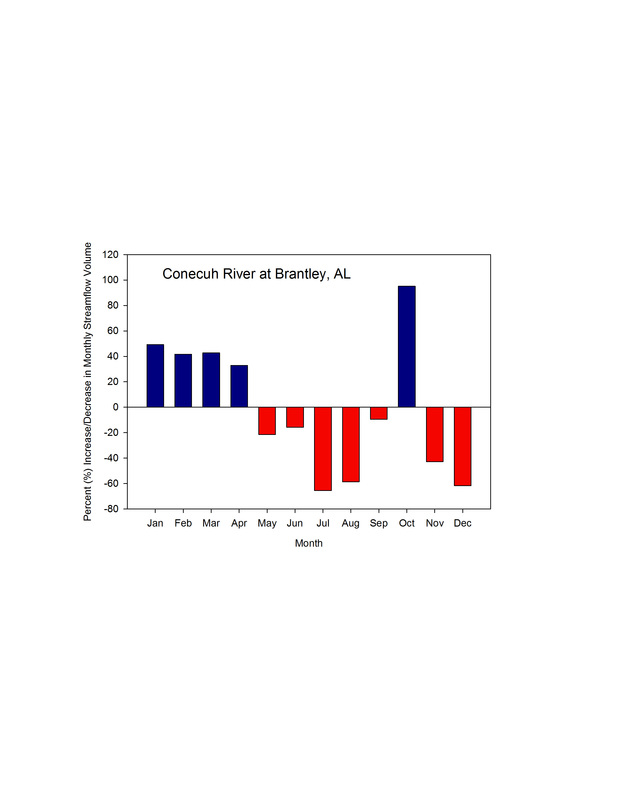
Monthly streamflow (cfs) was converted to monthly volume (Acre-Feet or AF). The average volume of flow for each month, for each station, for the station's entire period of record were determined. Next, the average volume of flow for each month, for each station, for year's (1966, 1973, 1988 and 1998) following an El Nino event were determined. The average monthly flow volume for the year following an El Nino event was compared to the long-term average monthly flow volume to identify patterns in streamflow response to the El Nino event.
|
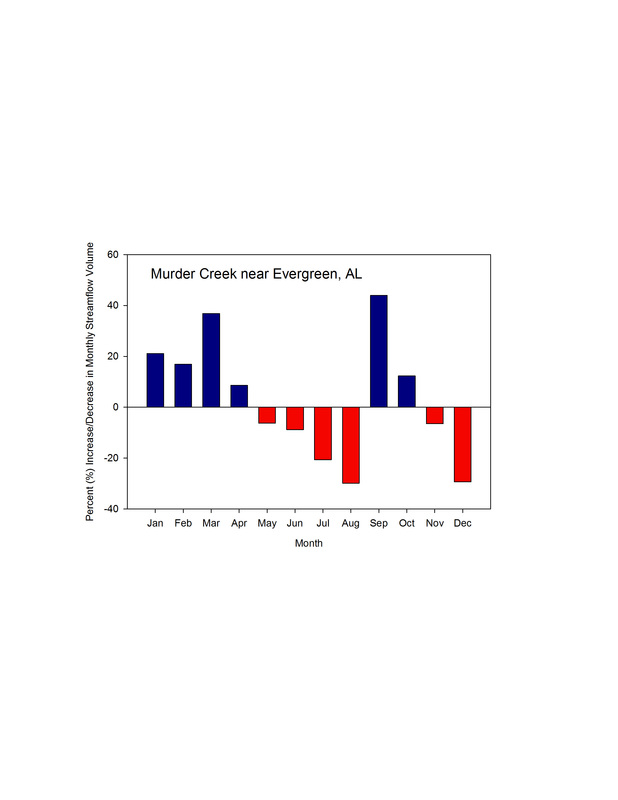
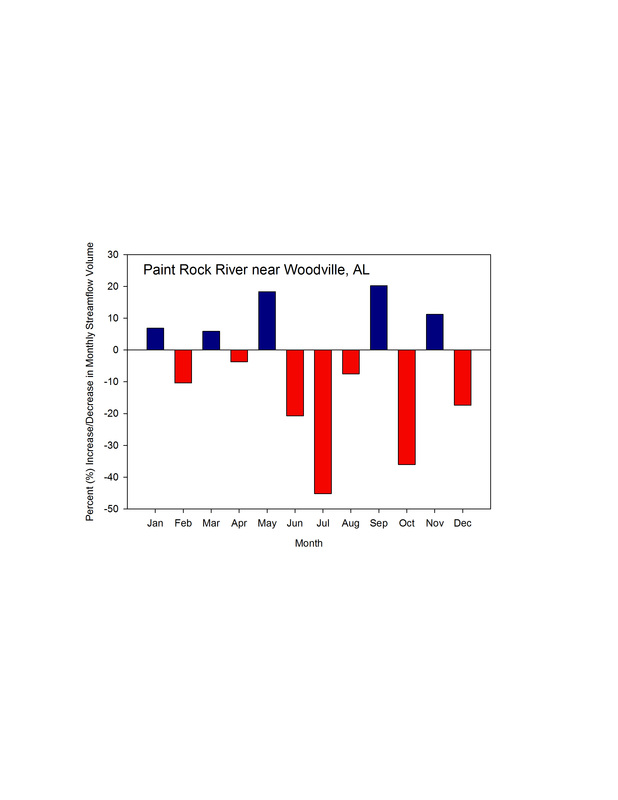
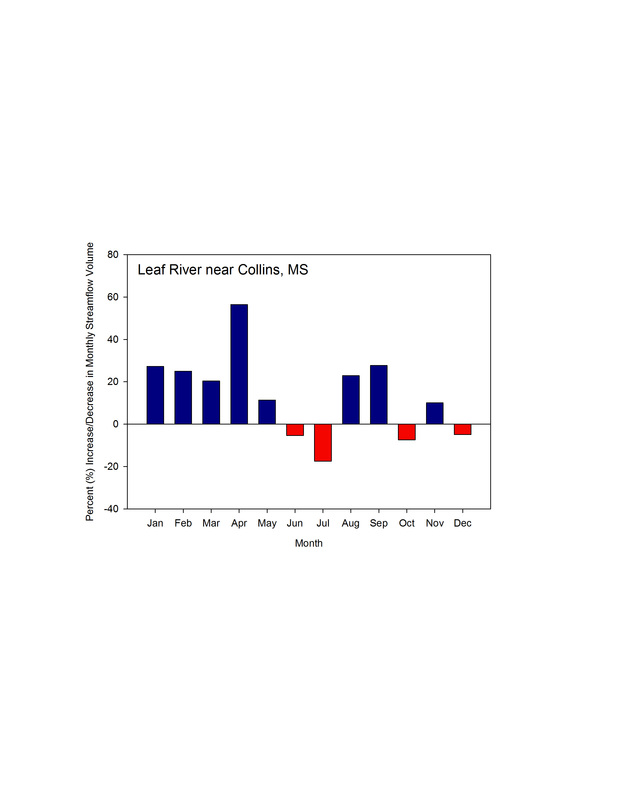
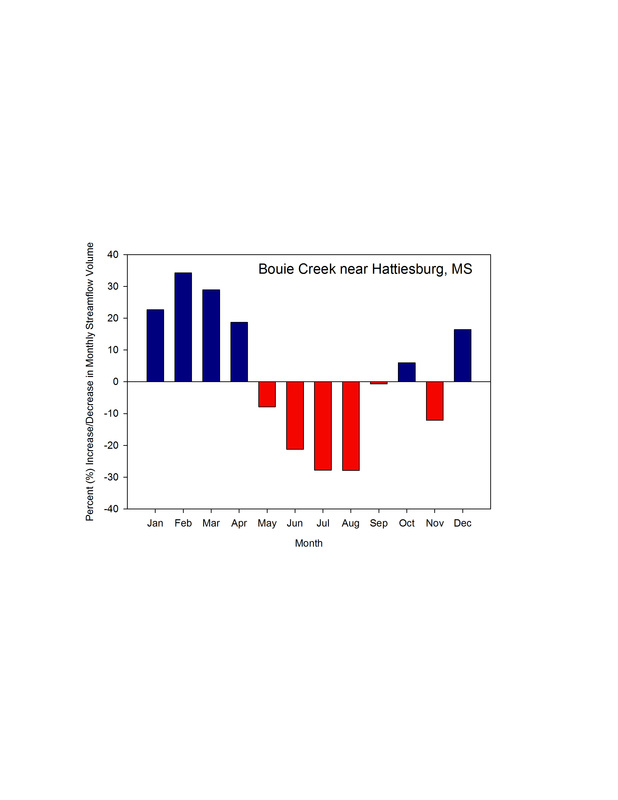
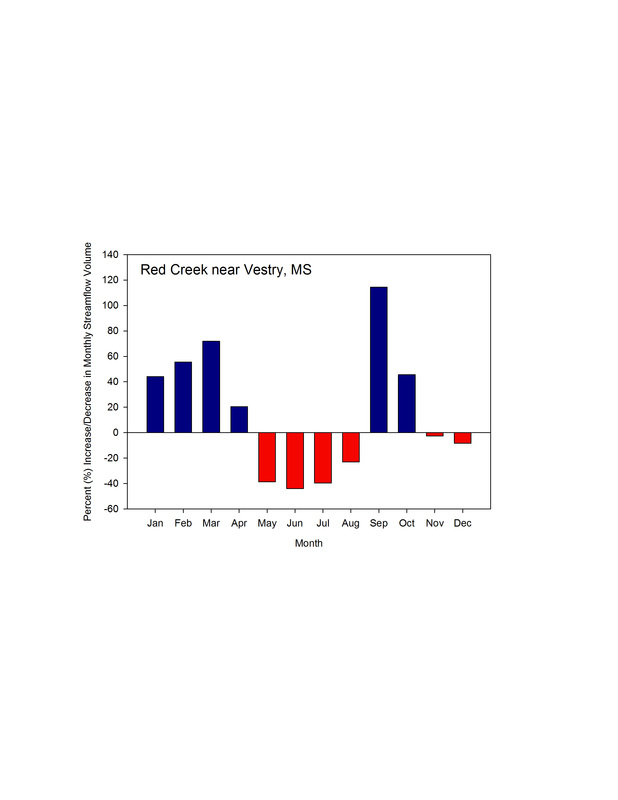
Calendar year streamflow volume for the year following an El Nino event increased for six of the seven stations (Paint Rock River near Woodville AL being the exception) with an average increase of approximately 13%. However, per the station figures below, it appears the monthly temporal variability of streamflow consistently shows large percentage increases during the winter and early spring months (historically the high flow months) while there is a decrease in streamflow during the summer months (historically the low flow months). The Paint Rock River near Woodville AL again appears to be the exception to this pattern which may be attributed to the location (northern Alabama) when compared to the other six stations (coastal Alabama and Mississippi). Thus, for 2016, we would expect winter and early spring flows to be above normal while summer flows would be below normal. Future research will evaluate precipitation datasets in Mississippi and Alabama, anticipating similar trends in precipitation (rainfall).
| ||

Support provided by Sea Grant Mississippi-Alabama, Geological Survey of Alabama and the University of Alabama Environmental Institute. Thanks to Paul Miller, PhD (NOAA) and Abdoul Oubeidillah, PhD (UCAR) for their assistance. Glenn Tootle, PhD, PE, Matt Therrell, PhD and Bennett Bearden, JD of the University of Alabama serve as the Principal Investigators.
